Choice under Certainty with multiple KPIs
Last Updated on 28. April 2023 by Martin Schuster
Typically, options have more than one KPI that matters for us. In this case, we need to aggregate all of them into a single variable that tells us the best option.
Let’s consider the following situation. We have to choose a car. Our KPIs are horsepower, price, space, and color.
The following table shows the values of the KPIs for each car.
| Car | KPI 1 | KPI 2 | KPI 3 | KPI 4 |
| Horsepower | Price | Space | Color | |
| Car 1 | 90 | 25,000 | 250 | Silver |
| Car 2 | 50 | 22,000 | 220 | White |
| Car 3 | 120 | 33,000 | 190 | Red |
| Car 4 | 55 | 35,000 | 180 | Pink |
We see that all KPIs are different with different properties and scales.
Some are numerical values, while one (color) is not.
If we don’t have numerical values, we need to assign numerical values. If we take the colors, we can assign a score to each color. We assume that more points are better. Then, our table would look like that.
| Car | KPI 1 | KPI 2 | KPI 3 | KPI 4 |
| Horsepower | Price | Space | Color | |
| Car 1 | 90 | 25,000 | 250 | 5 |
| Car 2 | 50 | 22,000 | 220 | 2 |
| Car 3 | 120 | 33,000 | 190 | 3 |
| Car 4 | 55 | 35,000 | 180 | 1 |
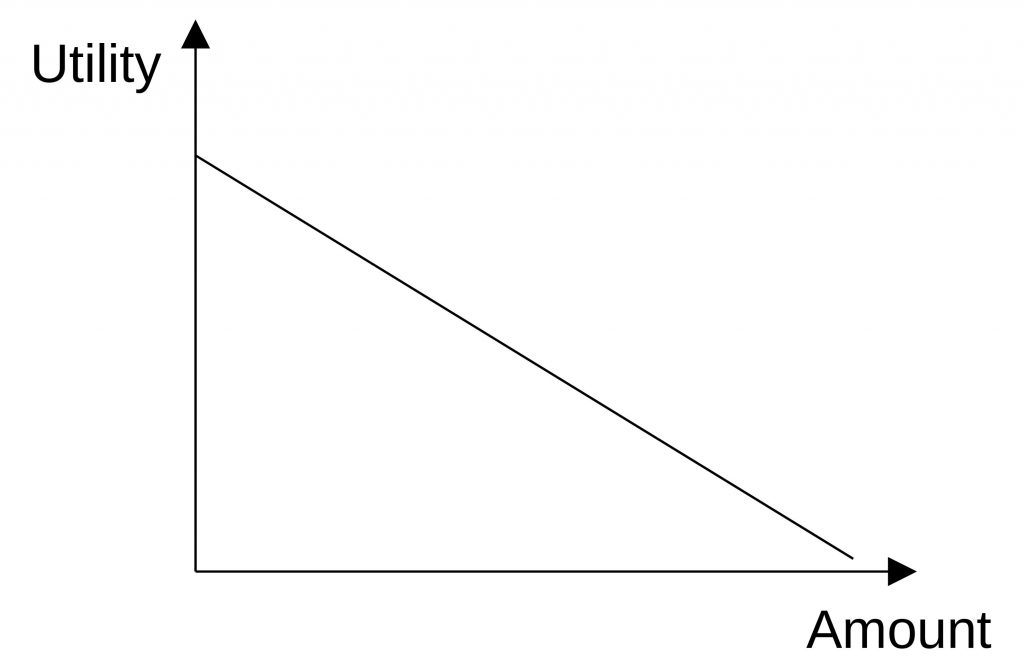
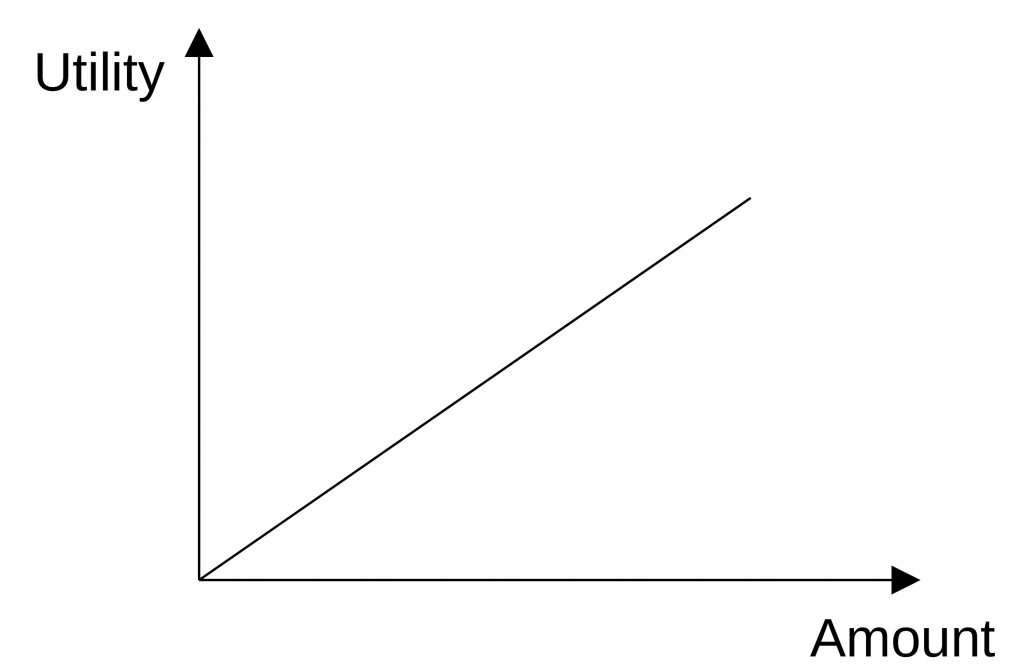
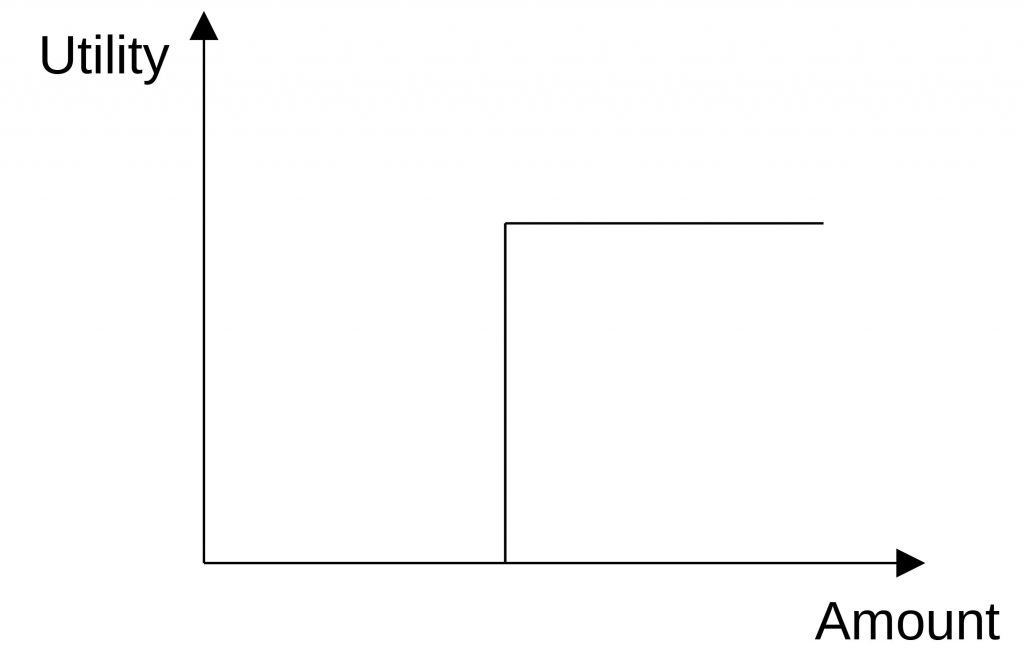
In some cases (horsepower, space), more is better. In other cases (price), the opposite is right. If more is better, the utility increases with every unit more that we receive.
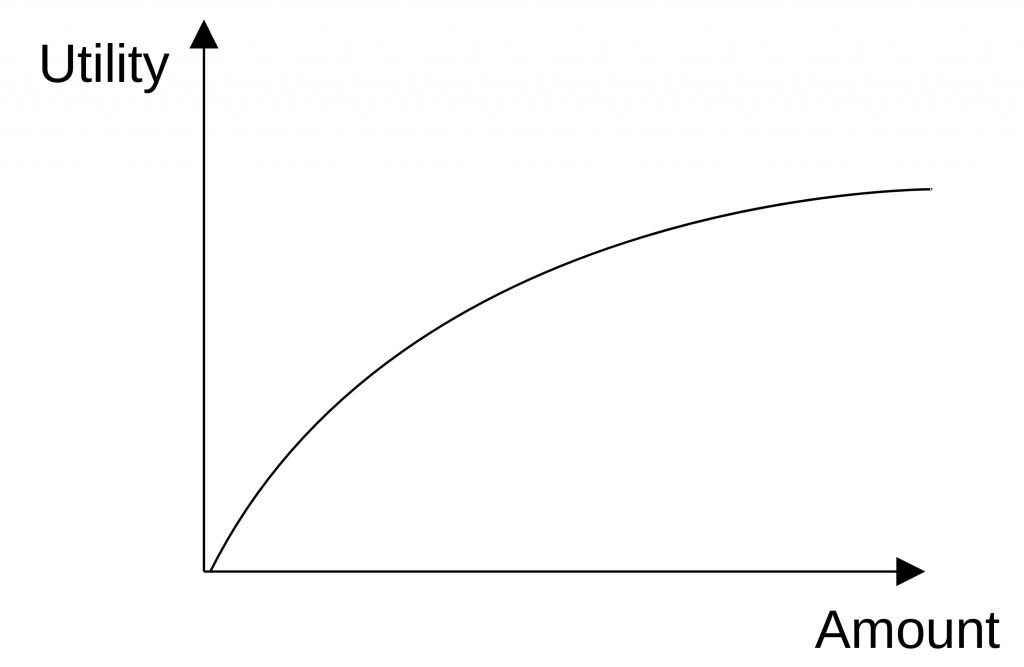
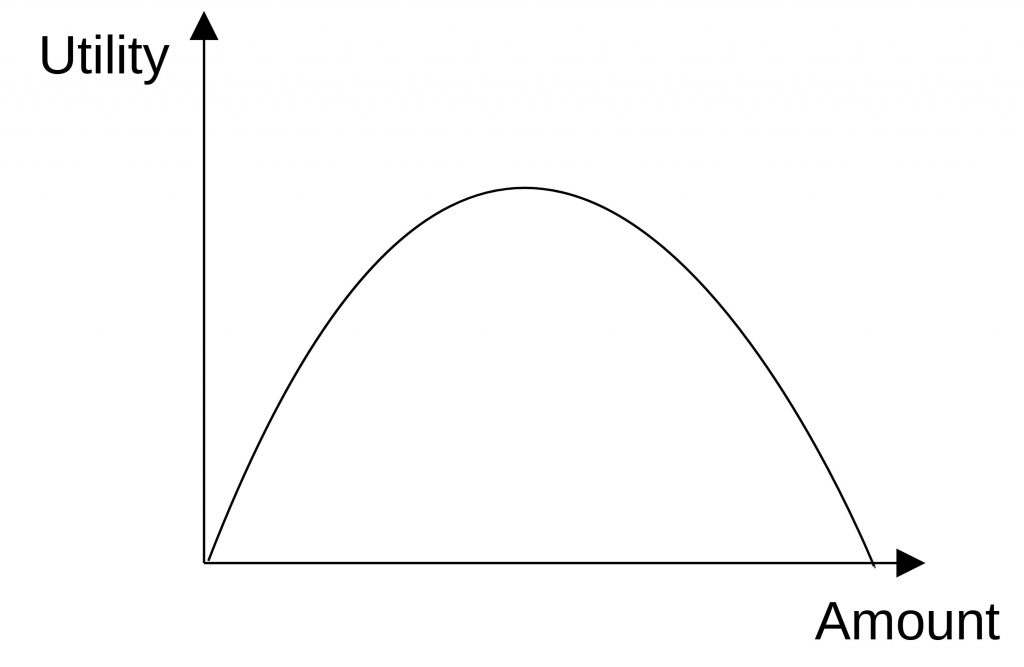
One thing we need to take into account here is, whether the increase (or decrease) of the utility is linear or declining. There can be a saturation or a threshold. The following figures show the utility functions.
Another problem we have is that even the numerical values have different units. It is hard to compare liter (for space) with EUR (for price) or HP (for horsepower). For that reason, we need to normalize the values.
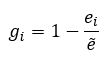
Assuming a linear growing utility function, we can do this with the following formula. g is the achievement rate.

- gi: achievement rate of option i
- ej: value of KPI of option i
- ẽ: best value or target value of KPI
If we assume a linear declining utility function, we can calculate the target achievement rate with:
- gi: achievement rate of option i
- ej: value of kpi of option i
- ẽ: best value or target value of kpi
If we calculate this for the horsepower, we have to decide what we choose for ẽ. This could be the best option available, or it could be our preferred value. Here, we choose the best option available in our list of options.
g1HP = 90/120 = 0.75
g2HP = 50/120 = 0.417
…
For the price, we have a declining utility function.
g1Price = 1-25,000/35.000 = 0.286
g2Price = 1-22,000/35.000 = 0.371
…
If we fill the table with our target achievement rates, we get:
| Car | KPI 1 | KPI 2 | KPI 3 | KPI 4 |
| Horsepower | Price | Space | Color | |
| Car 1 | 0.75 | 0.286 | 1 | 1 |
| Car 2 | 0.417 | 0.371 | 0.52 | 0.4 |
| Car 3 | 1 | 0.057 | 0.76 | 0.6 |
| Car 4 | 0.458 | 0 | 0.72 | 0.2 |
Table with target achievement rates for four options and four KPIs.
Now, we need to aggregate all target achievement rates into one value. The question is, how much influence each KPI has on the final result. There are different methods:
- Equal weighting
- Direct ranking
- Swing weighting
- Trade-off method
Equal weighting
The easiest method is to weigh every KPI equally. This works by adding all target achievement values of each option and calculating the average.
For car 1 we get (0.75 + 0.286 + 1 + 1)/4 = 0.759
For car 2 we get (0.417+0.371+0.52+0.4)/4 = 0.427
For car 3 we get (1+0.057+0.76+0.6)/4 = 0.60425
For car 4 we get (0.458+0+0.72+0.2)/4 = 0.3445
We choose the car with the highest value. This is car 1.
Direct Ranking
With direct ranking, the decision-maker attributes scores to each KPI. The score should be in a range, e. g. [0,10]. A score of zero means not relevant. A score of 10 means very relevant. Different KPIs can have the same score.
Then, the raw weights r are normalized to 1 by dividing the score of a kpi by the sum of the scores.
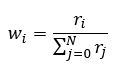
wi: weight of the KPI i
N: number of all KPIs
In the following table, we gave every KPI a score:
| KPI | Score |
| Horse Power | 9 |
| Price | 4 |
| Space | 3 |
| Color | 3 |
The weight for horse power is: wHP = 9/(9+4+3+3) = 0.47
The weight for price: wPrice = 4/(9+4+3+3) = 0.21
The weight for space is: wSpace = 3/(9+4+3+3) = 0.16
The weight for color is: wColor = 3/(9+4+3+3) = 0.16
Now, we calculate the rank by multiplying the target achievement rate with the weight and summing it up.
| Option | Calculation | Rank |
| Car 1 | 0.75*0.47+0.286*0.21+1*0.16+1*0.16 | 0.733 |
| Car 2 | 0.17*0.47+0.371*0.21+0.88*0.16+0.4*0.16 | 0.421 |
| Car 3 | 1*0.47+0.057*0.21+0.76+0.16+0.6*0.16 | 0.7 |
| Car 4 | 0.458*0.47+0*0.21+0.72*0.16+0.2*0.16 | 0.362 |
We choose the option with the highest rank. In our case, this is car 1.
If we assign weights manually, we must make sure that we are rational. The manual assignment is difficult to rationalize and document. That’s why other methods can be used that try to reduce subjectivity.

 Register
 Sign in